Mineral Resource Investigation
Mineral Resources include metallic and non-metallic (industrial) minerals with potential for economic value. Mineral resources are the raw materials to extract metals of economic value. Examples are minerals that contain value as iron, copper and molybdenum are raw ingredients used to manufacture steel, copper wire, automobiles and home appliances. Industrial minerals as limestone, clay or gravel are used to make cement and concrete. Investigations encompass the deliberate search for, description of, and delineation of these mineral deposits. Two examples of the HydroImage technology (below) demonstrate its exploratory use for mineral commodities contained in: an industrial mineral resource and a metallic mineral resource. The purpose of each project is to expand the geologic knowledge to more fully describe each deposit.Mineral Resource Investigation
An understanding of metallic and industrial (non-metallic) minerals is important to our society because of our enormous dependence on mineral resources. Mapping and describing these resources is key to this understanding.A common product is constructing a three-dimensional image of what’s underfoot. Two examples of resource mapping presented are: Ask about our ... investigations of metallic and industrial mineral deposits
1. Sand and Gravel Resource Mapping
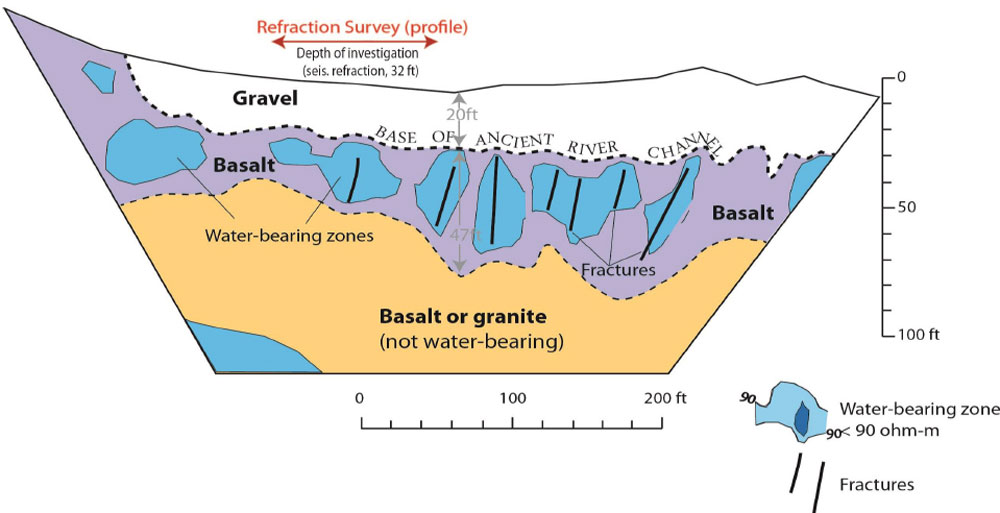
Geologic profile (right) is constructed by combining results from electrical resistivity imaging and seismic refraction profiling surveys.
Electrical Resistivity and Seismic Refraction
Separately, at the site Utah site of Case Study 6 we suspected that the resistivity values of the sand and gravel layer should differ markedly from those of the underlying limestone bedrock due to large differences in water content. This was shown to be true as the work identified the bedrock interface due to a substantial difference between the sand-gravel and the limestone bedrock. Case Study 6
2. Ore Deposit Mapping
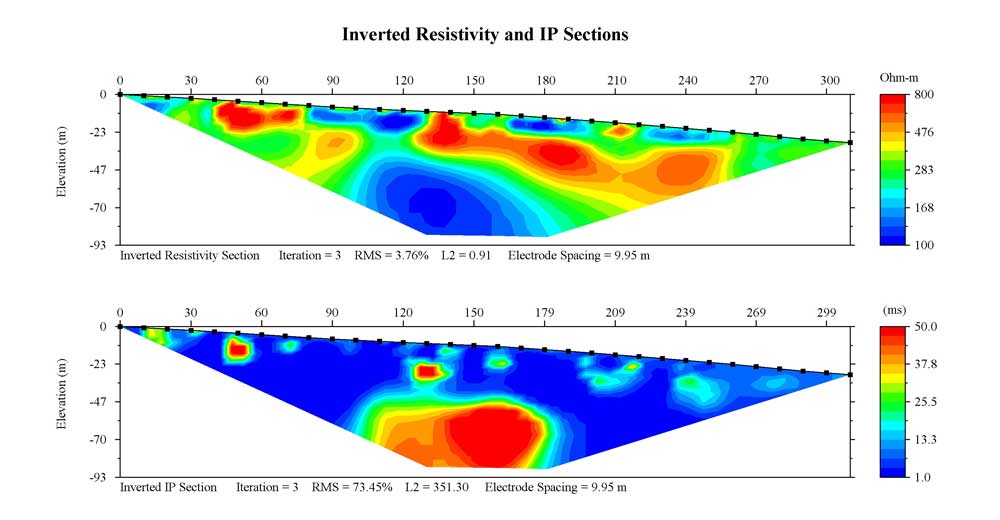
The objective at a metals exploration project in Montana was to locate drilling targets based on their anomalous polarization characteristics using induced polarization (I.P.) imaging.
Earth Resistivity and Induced Polarization Imaging (combined operation)
The earth resistivity combined with induced ERI+IP tool is the workhorse method applied to ore deposit mapping. Our most popular field data collection platform provides the newest technology for simultaneous recording, processing, and imaging of earth resistivity imaging (ERI) and induced polarization (IP) data. The ERI+IP tool uses the high-speed and ultra-portable SuperSting R/IP acquisition system and data processing using EarthImager software. Using the 36-electrode, fixed-spacing distributed cable, the SuperSting can acquire up to 1800 resistivity measurements daily, including layout and take-up of equipment under ideal conditions. The result produces geologically-realistic resistivity and induced polarization images, called a HydroImage to provide rapid assessments of the subsurface rock strata.
Layout and recording options for the system fit any situation. Data acquisition modes include profiling, sounding, roll-along, 2-D, 3-D gridding, down-hole tomography, or manual 4-wire methods. The SuperSting features six recording array types (Schlumberger, inverted Schlumberger, dipole-dipole, pole-pole, pole-dipole, or a combination) and the software permits forward, inverse, and simulation modeling to improve interpretation of data.
This system can regularly acquire data to a depth of 300 ft, but under some conditions depths to more than 430 feet can be imaged. Rate of progress for earth resistivity imaging surveying using 2-3 person crew ranges from 2,000 to 3,000 ft per day.
How It Works
The IP-Res method is the simultaneous recording of earth resistivity imaging (ERI) and induced polarization (IP) data. It allows creation of a geologic map of a metallic “ore” body. Geologic data can be inferred from the resistivity information while any capacitive effect of a metallic ore body is recorded from the induced polarization information. Some metallic minerals retain an electric charge from the deep cycle battery but the bleed off is delayed after the power is shut. The length and strength of the delay measurement, or polarization, gives an indication of metallic minerals.
A survey of 1,75 line-meters in length succeeded in locating a promising zone containing anomalous polarization values to be examined in the next field season
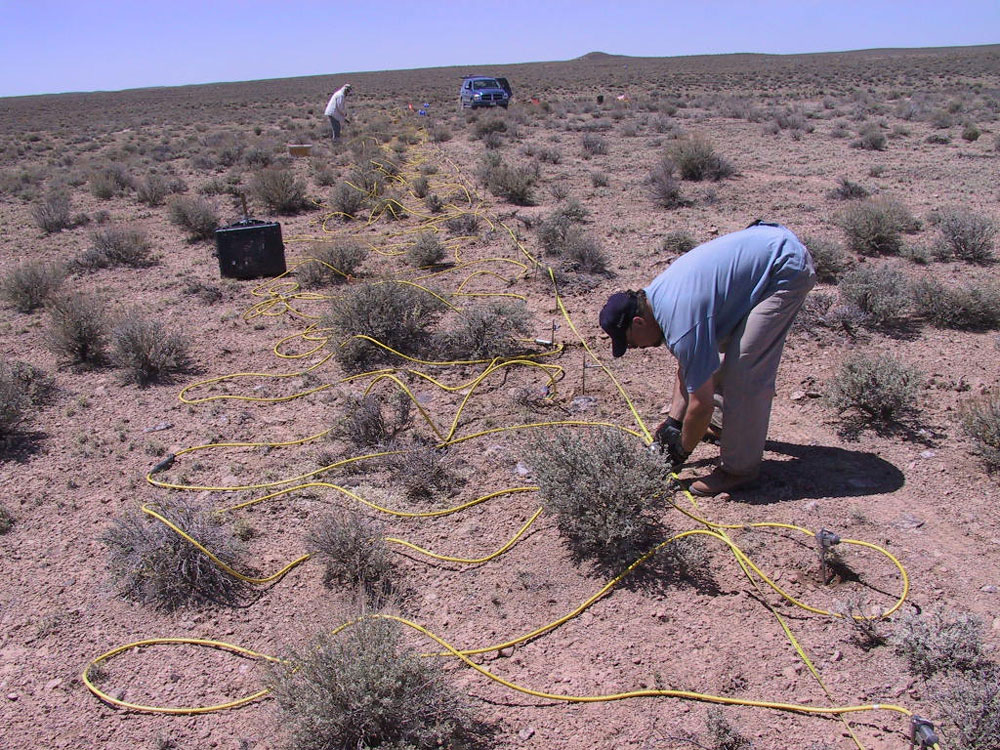
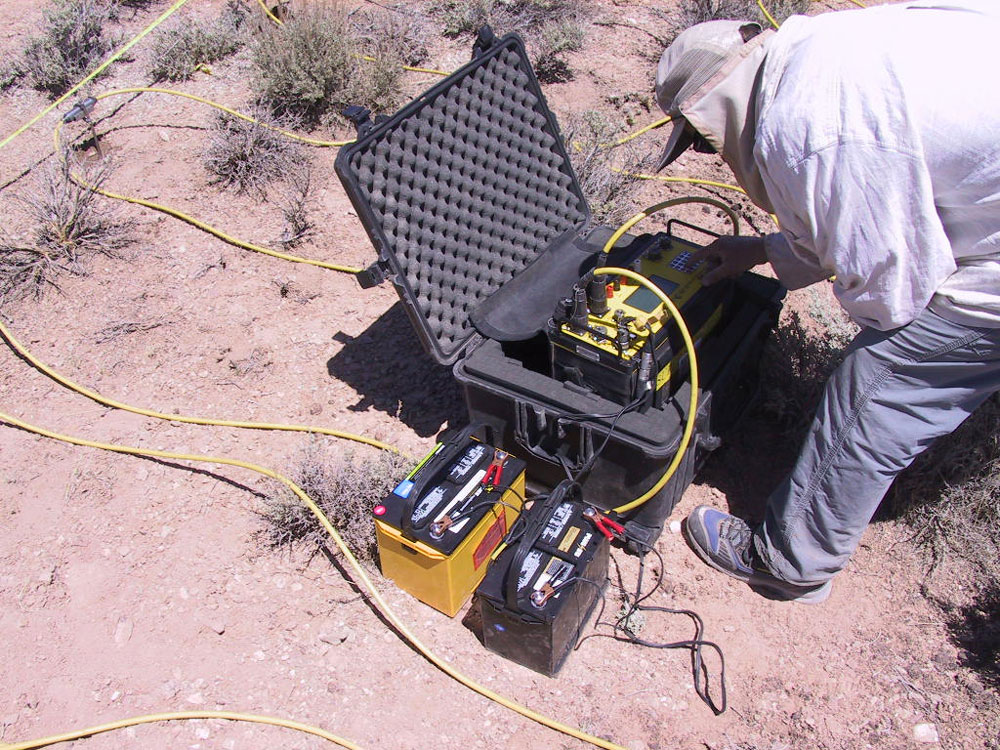
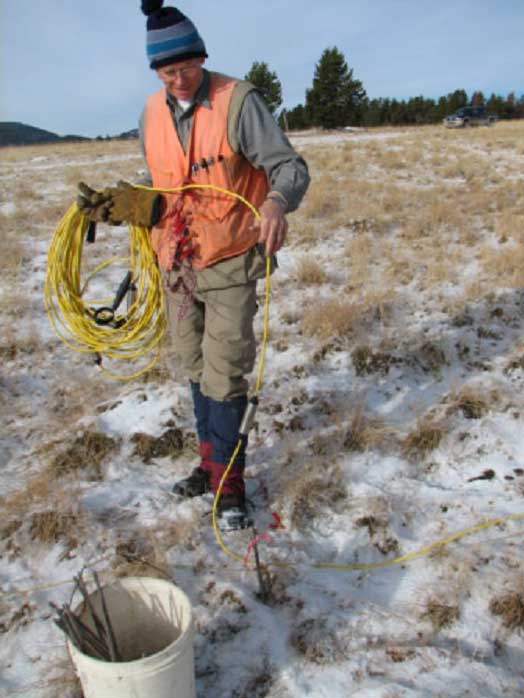
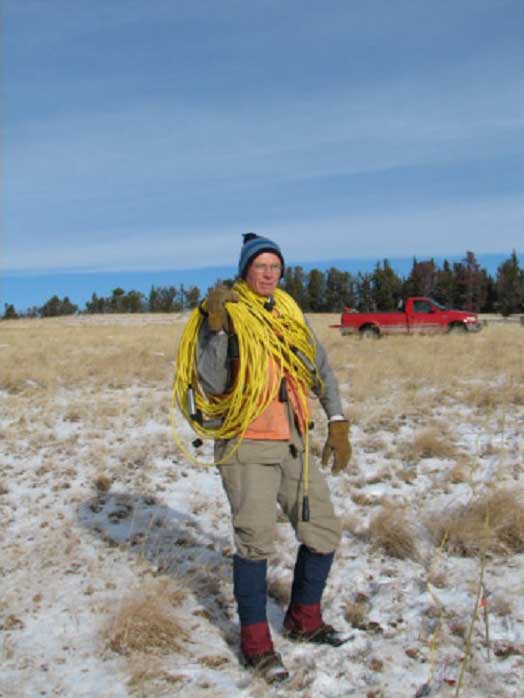
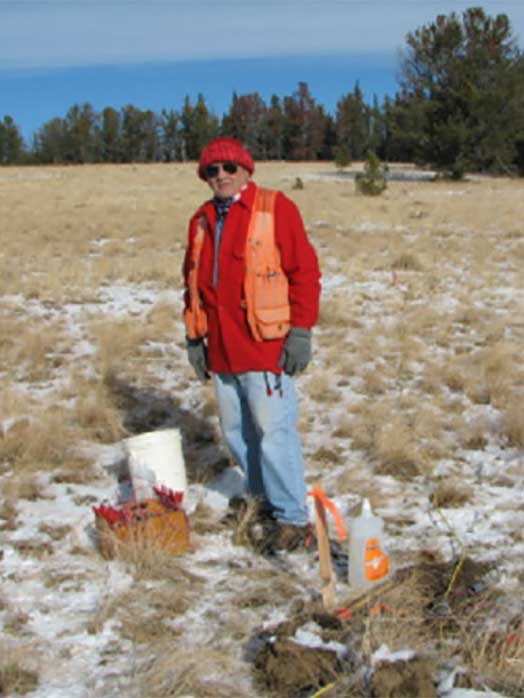
The field equipment consists of a transmitter-receiver, batteries for main and boost power, porous pots, steel stakes, and a yellow connecting multi-conductor cable with “smart” electrode switching capability.
Staked locations (steel stakes) for up to 100 “smart” electrodes are connected along a multi-core cable with stake spacing ranging up to 20 m. A transmitter-receiver controls the survey and records the data according to pre-set commands.