EQUIPMENT, TECHNOLOGY
Enormous cost savings due to the advent of high speed computer processing has catapulted new tools to find water and locate mineral deposits using geophysical technology. Homeowners, builders, contractors, municipalities, agricultural irrigators, and major corporations are beneficiaries.1. SEISMOELECTRIC SOUNDING
The seismoelectric method records an electrical impulse returned when a seismic sound wave (created from a sledgehammer impact, for example) intersects a water-bearing zone or aquifer. The electric impulse, or seismoelectric effect created is likened to static electricity from rubbing a balloon.How It Works
Two pair of copper electrode antennas set adjacent to the seismic source detects the voltage response. The strength of the voltage response returned, delay and its duration approximates the water yield, depth and thickness of the aquifer. Information about density (or stiffness) of the rock between surface and the aquifer and timing of the received signal improves the interpretation. These parameters are obtained from a calibration experience in a familiar area, or from a new seismic refraction survey.
The major advantage of the seismoelectric method lies in success in locating water. How useful is it?
How Water Is Found
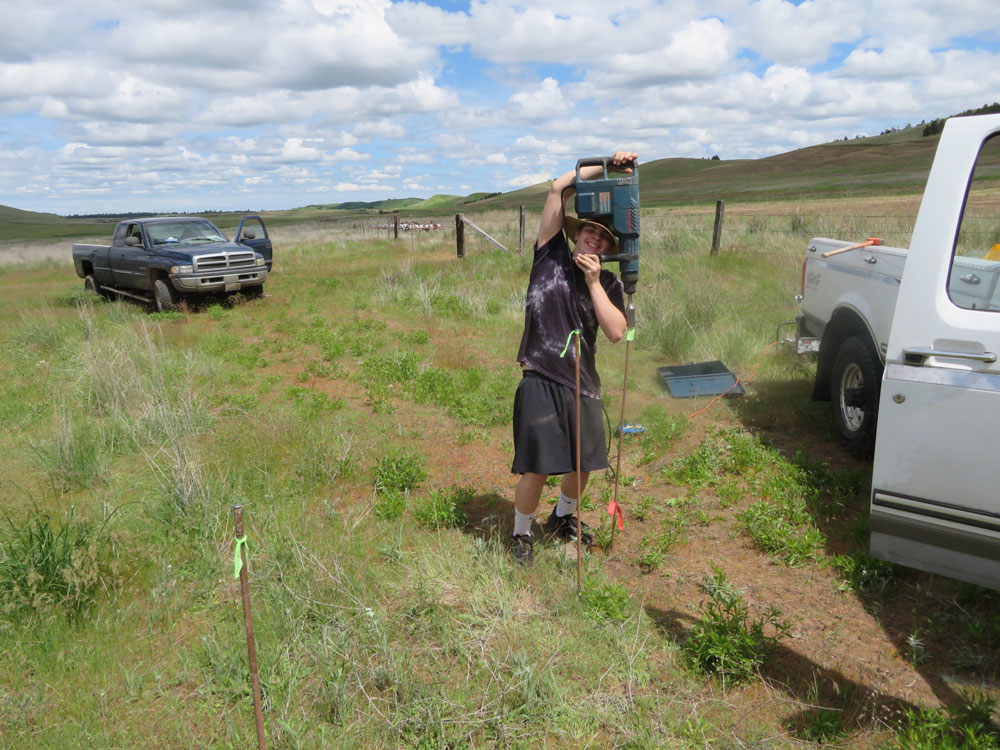
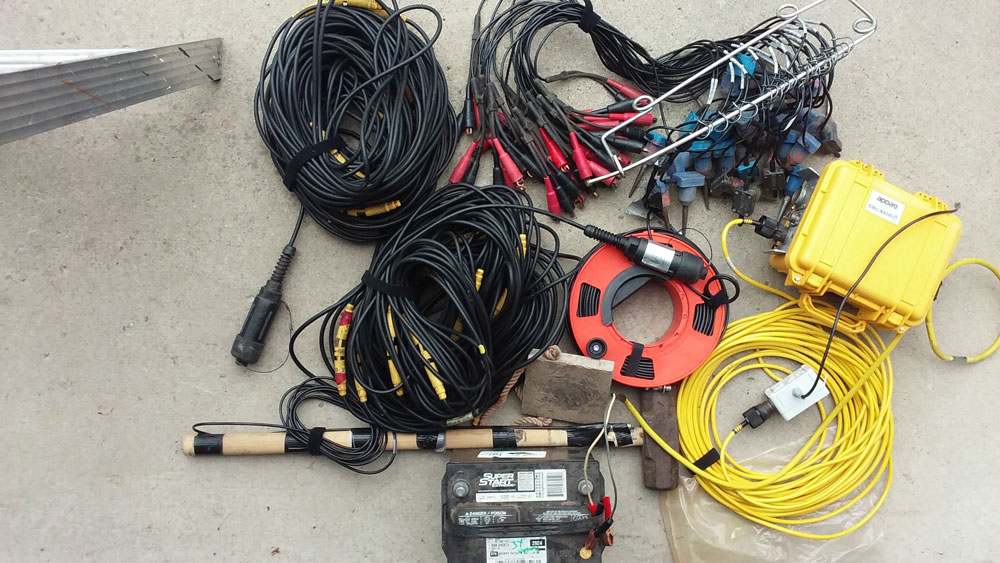
Equipment is installed at the site before recording begins includes a seismic source to create a sound wave and a receiver consisting of pairs of copper rods to receive the electrical signal. Data from one site can be recorded in a short time but a survey requires that many sites be occupied to confirm results. The seismoelectric method provides data at a single site, so in order to provide data in a profile many several sites must be occupied and data recorded. The multiple sites permits data be collected to assemble a “picture” or profile as well as building confidence about the water resource available. Several Sites Explored
A survey consists of collecting data at a minimum number of sites in agreement with customer. The number of sites to occupy varies with the success found in locating water (or not locating) at each site. Results of an approximate nature are evaluated immediately in order to decide how to proceed. If water is located at a site then the result must be confirmed by nearby sites.
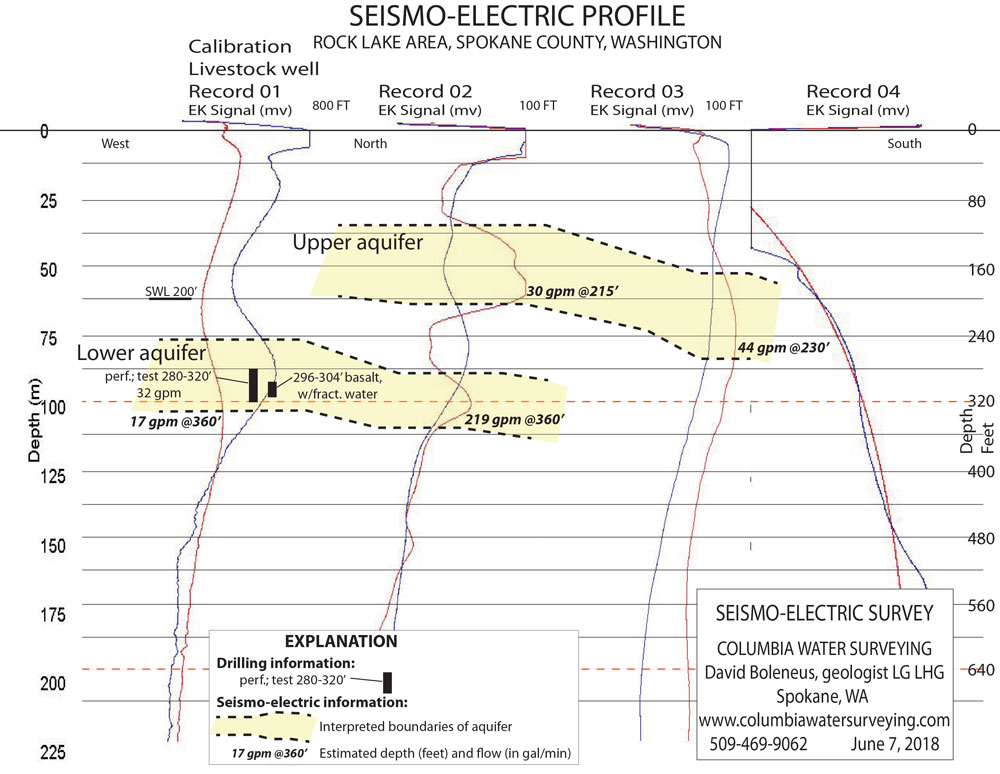
Illustrated are results of four soundings (records 1-4). Interpretation of results is assisted by arranging sounding data into a profile set to a common elevation to allow a record-to-record comparison. The profile shows that two aquifers have been identified (yellow shading), an upper aquifer and a lower aquifer, with each identified in two of the soundings. It is significant that the lower aquifer conforms with data found at the calibration sounding at an existing well (record 1) and on the adjacent sounding (record 2). The calibration can be extended to record 2 and in doing provides strong evidence to recommend drilling to the lower aquifer at site of record 2. Drilling at site 2 must proceed to the base at 360 feet depth to fully evaluate the aquifer. The yield of water suggested is 21 gallons per minute.
Over 20 sites may require surveying for more challenging conditions or in search of water for irrigation or commercial purposes. A DECADE OF SUCCESS.
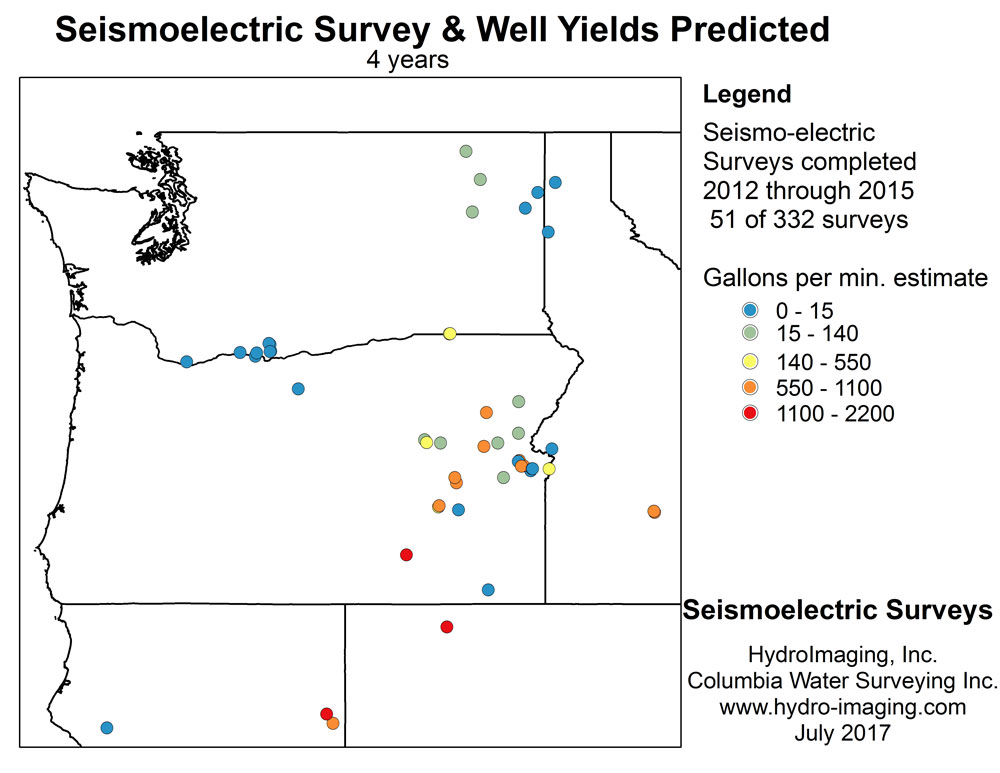
The seismoelectric method has been in use by Columbia Water Surveying across the five-state area for more than a decade. HydroImaging acquired Columbia Water Surveying in 2017.The map shows the location of 51 water surveys conducted during 2012 to 2015. In all, a total of 336 projects have been conducted in the region since 2003. The color code on the map symbol shows both the location and yield of wells (in gallons per min.) estimated from the seismoelectric results. Estimates of yield (or flow rate) range from 0 to 2200 gallons per minute.
WHAT IS SEISMOELECTRIC?
Seismoelectric effect depends on streaming potential or the electric charge developed by the impact of a seismic wave on the boundaries between rock particles and water with an electric charge and electromagnetic charge the result. It describes the coupling between seismic waves and electromagnetic fields in partially or totally water-saturated rock. It is a method known for 75 years and applicable to shallow groundwater operations while introduced to geophysical field operations about two decades ago. It can provide high-value information about permeability and porosity, the space occupied by water in rocks. The method was discovered by Russian scientists Ivanov and Frenkel in Moscow. Ivanova in 1939 at the Institute of Earth Physics was the first to record seismoelectric effects in field conditions while in 1944 Frenkel at the Institute of Theoretical Geophysics was first to describe the theory of wave propagation
2. SEISMIC REFRACTION PROFILING
Seismic refraction is also an important to address an array of engineering, mineral resource and environmental questions. Larger scale seismic refraction and reflection surveys are the primary tools used to explore for oil and gas deposits. Shear-wave seismic or MASW seismic surveys are used to examine physical properties of soils at building sites or bridge foundations.
HOW IT WORKS
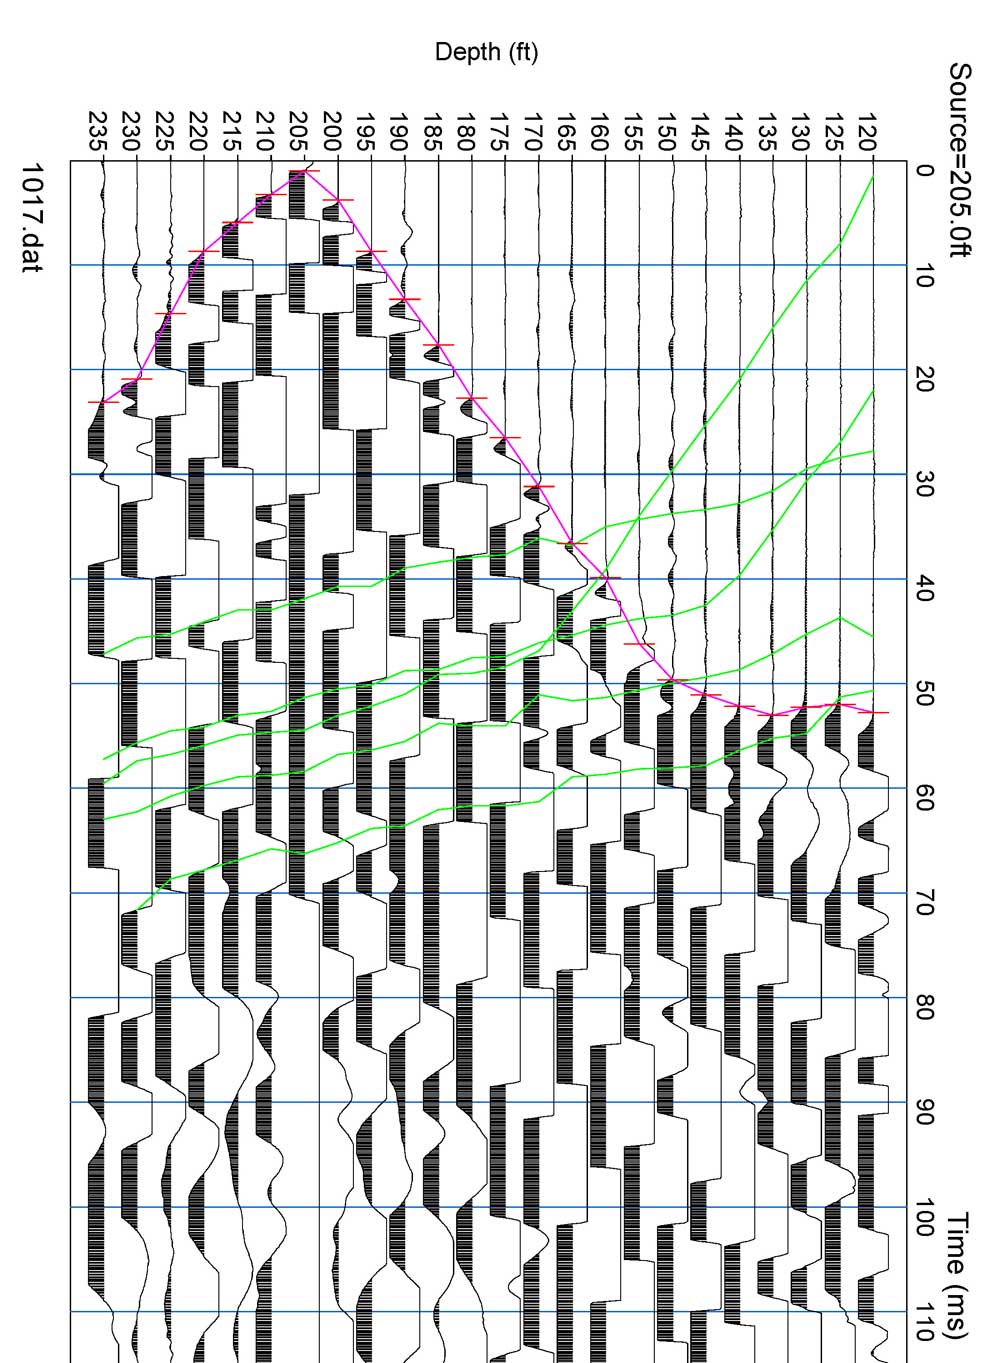
This single channel method no longer in service requires more time because the sledgehammer must be moved for each record taken (plot, at right).
A sledgehammer impact used as a seismic source is digitally recorded at 24 closely spaced receiving stations (called geophones) evenly spaced at 5-ft, 10-ft, or 20-ft intervals along the length of the spread cable. Multiple receivers permit an increase in efficiency, speed, and for ease of interpretation.
The velocity that sound travels through any particular layer is determined by the inverse of distance by time. The method is particularly useful for shallow surveys not exceeding 100 feet.
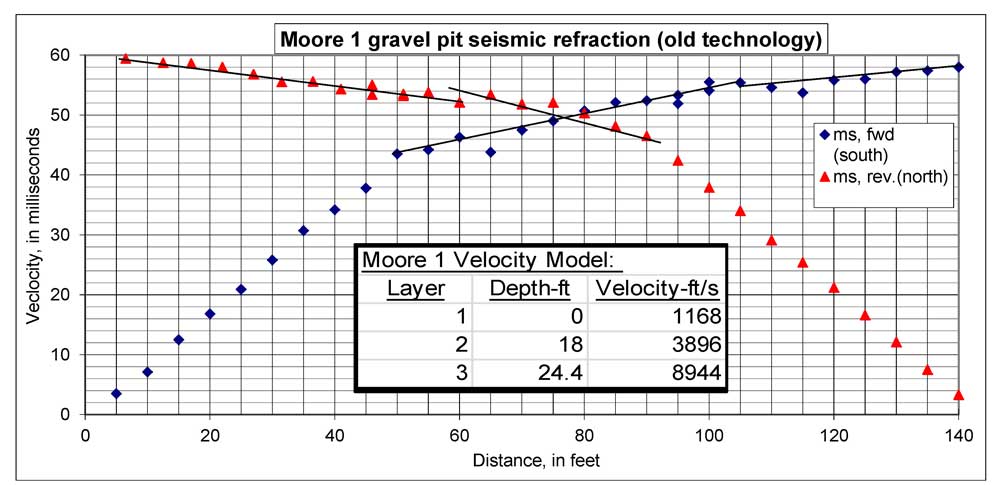
Moore Gravel Pit Seismic Refraction Record (new technology)
Data collected at the same site using 24-channel equipment employs current technology with Geode seismograph. Chart: Time in milliseconds (ms) is displayed along right side axis and distance along ground in feet along top axis. A seismic impact created with a 16-pound sledgehammer at position 205 feet displays sound recorded simultaneously at each of the 24 recording sites. A few milliseconds of time is required for sound to reach more distant recording sites (red).
Change in slope of the red line at 150 feet indicates time that sound encountered higher velocity layer 2 below the base of gravel layer. Green lines represent recordings made nearby for the project of total of seven recordings needed to construct geologic model.
1 millisecond (ms) = one thousandth of a second
FINDING WATER IS DATA, DATA…
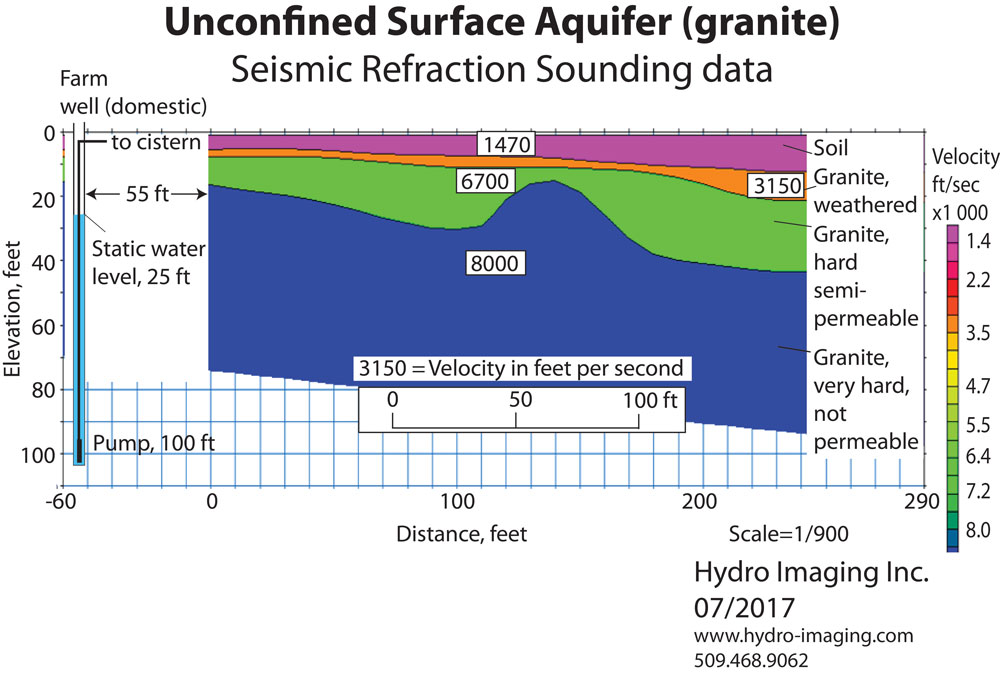
A comparison with the livestock well nearby (left side of chart) shows the aquifer can be identified as the deepest rock unit (light blue in color). Each rock unit can be identified by the rate that sound moves through the rock. The aquifer, in this case, is a granite. The interpretation shows sound travels through the granite at a velocity (or travel time) of 8800 ft per second.
3. ELECTRICAL RESISTIVITY IMAGING.
HOW IT WORKS.
Electrical resistivity imaging takes advantage of differences in resistivity (or its opposite characteristic, the conductivity) of rock or strata below ground surface. A deep cycle battery supplies current and voltage transmitted from one grounded steel electrode pair while current/voltage is recorded simultaneously at a second pair. The difference in current/voltage between the transmitter and receiver permits estimating average resistivity, according to Ohms Law. The field computer auto-records several hundred measurements across numerous combinations of transmitter-receiver locations.
Once collected, the data are then spatially organized for interpretation into an apparent resistivity profile or HydroImage to represent the location of water-bearing (and non-water-bearing) rock or strata along the profile. The colored profile is a display of resistivity variations to a depth up to 350-400 feet beneath the ground surface.
CHALLENGED TO FIND A WELL SITE
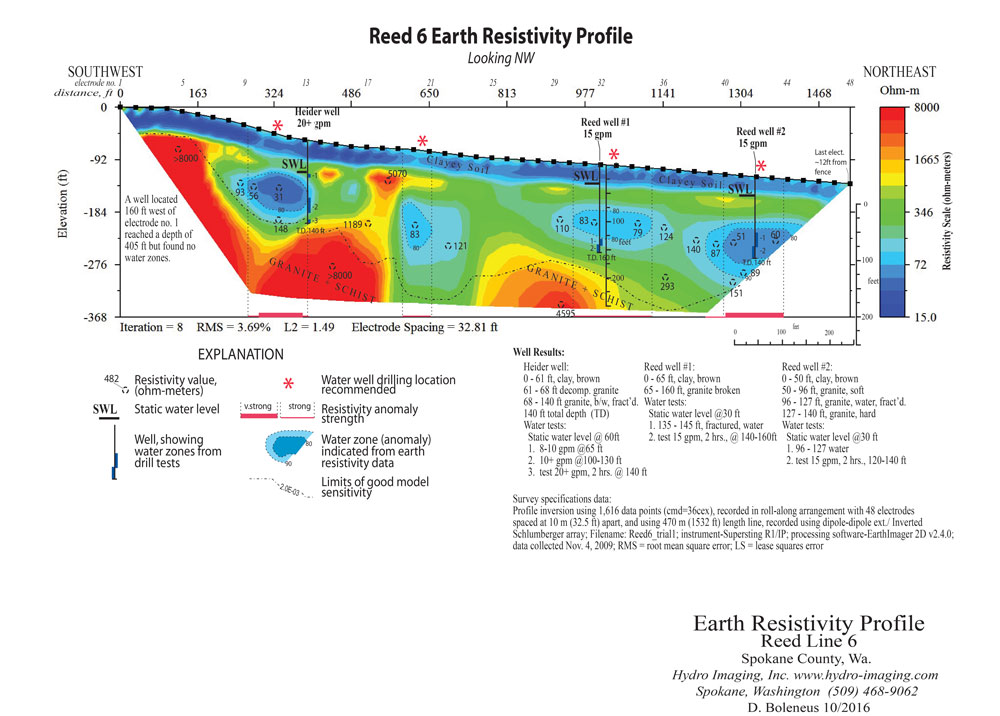
One of two, 1,530 foot long electrical resistivity profiles were recorded parallel to the county road near Cheney, Washington. The owner had previously drilled two dry holes (both were atop a hill with a fabulous view) before requesting assistance. The area is underlain by granite, an igneous rock and gneiss, a metamorphic rock, so water was found to occupy cris-crossing fractures that create the storage space for water to accumulate. Profiling using the electrical resistivity method is suited because the water is a weak electrolyte that readily divulges location of aquifers, while the location of the targets with these characteristics cannot be deciphered by other means.
Time to deploy and retrieve equipment and record data over accessible flat and open ground was 6 hours with field crew of 2 to 3 persons. Computer processing of data takes another hour. CRITICAL TARGETING: THE HYDROIMAGE
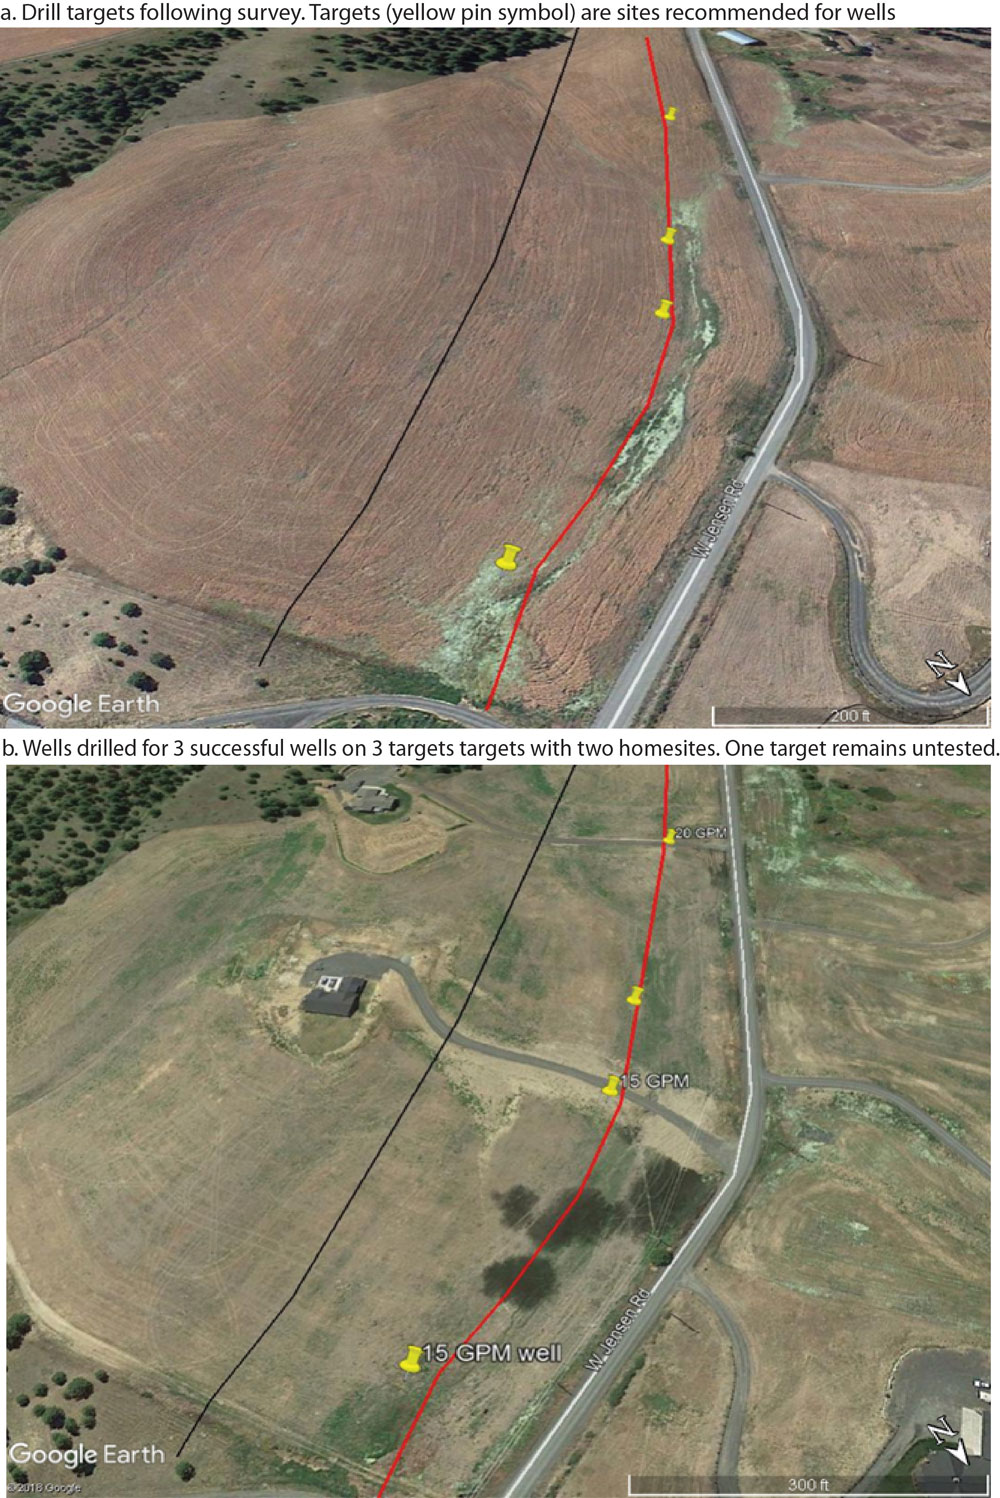
From the processed data, four locations were considered likely drill sites where water is suspected to occur within the bedrock. The processed HydroImage data allowed the land owner to instruct the drilling contractor as to maximum drilling depth and specific locations of targets to set equipment. Drilling at three of the four locations produced water flows that ranges from 12 to 15 gallons per minute. The fourth location has not been drilled (image b).
Our Investigative "Toolbox"
Chart shows range of investigations possible (left) compared to geophysical tool (top) available (coming soon)
Magnetic and Electromagnetic Surveying and Mapping
Several other methods we use also add capability to decipher information about rock strata in the subsurface, or below ground. The Investigative Toolbox displays the variety of tools and the jobs to which they can assist.
Several magnetic and very low frequency electromagnetic (VLF-EM) conductivity devices provide a range of data-collection options to meet general geophysical needs. Conductivity and magnetic surveys can record several hundred station data points on the ground daily. These devices are in wide use in the field of mineral exploration since they enable mapping of these characteristics over wide areas.
Electromagnetic surveys assist in geologic mapping of areas having thick overburden or thick soil cover. These instruments are used for detecting zones by their variable conductivity values, usually explained by changes in moisture content.
Magnetometers are used to locate magnetic boundaries of buried rock bodies, landfill trash, or indicate changes in the magnetic mineral content of rocks in the subsurface. The magnetic mineral content changes predictably with zones mineralized by minerals associated with gold, silver, copper, lead, zinc, and other minerals. The size, susceptibility, and magnitude of magnetic signatures can be related to depth and intensity of mineralizing by the magnetic minerals that accompany these valuable minerals. Magnetometers can also delineate shallow magnetic anomalies associated with buried iron drums, tanks, and barrels.